Understanding Networks: Wireshark Assignment
I did a couple different packet captures while figuring out how to use Wireshark. Doing it over the course of a couple hours made me appreciate the enormity of information passing through our networks – when I tried to shut the session down my entire computer froze up because it was trying to process around 4.6GB. I did a shorter one the next day (17 min), which gave me more manageable data with 366386 packets captured at 347.4 packets per second.
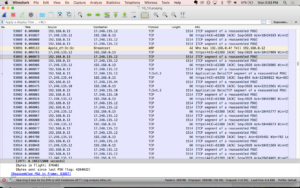
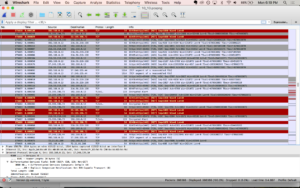
One of the first things I noticed was how many packets were TCP, with the occasional SSL. Looking at the color coding system. Wiresharks’s packet colorization rules made it really clear – scrolling through, I’d see mostly light purple interrupted by occasional bands of black and red. The red would mean a RST or reset flag was attached and I found this stackoverflow page that says the RST flag “signifies that the receiver has become confused and so wants to abort the connection” or that someone on the other end is trying to stop traffic. The black lines are TCP Dup Ack – TCP Duplicate acknowledgements and Fast Retransmissions. From what I can tell, it’s the network saying that packets are getting dropped.
I did WHOIS searches on a few of the IP addresses throwing RST and Dup Acks and mostly found Apple, Google, and Amazon…even if I wasn’t on any web pages owned by those companies. But also lots of links to cloud computing companies, consumer data analytics, ads, and content delivery networks (CDNs)
When I filtered out for just HTTP, there were 118 http packets out of 366386. Filtering for my ip address, I found that even though my roommate was home during that time I was doing all the web surfing. She, however, was showing up under UDP and SSDP (simple service discovery protocol) and one mDNS (multicast DNS) for a total of 74 packets. From what I can tell, it’s looking for network services? Filtering for my ip address, 99.9% of the packets were associated or 366023. So that’s 289 packets neither of our ip addresses can account for…
Listing all IP address in the capture, I found that 39 are from another ip address on the network (ending in 10), with packets labeled mDNS and IGMPv3 (a communications protocol used by hosts and adjacent routers on IPv4 networks to establish multicast group memberships). 74 packets were from the ip address ending in 1, which I assume is my router? That was mostly SSDP and some map requests associated with my ip address.
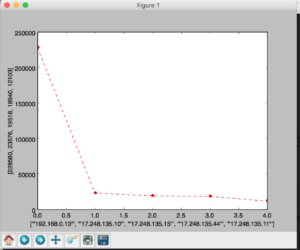
Overall, 228580 packets came from my ip address as a source (62.42%) and 137443 as destination (37.53%). The next six ips for both source and destination were apple, making up 26.41% and 46.74% respectively.
I tried creating a couple of bar graphs using google sheets, but it would only let me do just my HTTP (my other file was too large).
Ended up writing a python program that reads the source IP addresses, creates a dictionary with ip addresses as the key and the number of occurrences the value. I used matplotlib to plot the count of the top 5 source addresses.
Here’s the git repo: https://github.com/zoebachman/wireshark_analysis


